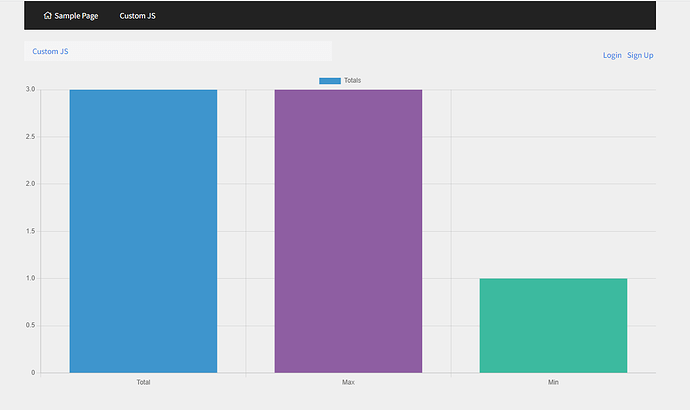
JSChart Custom Component

For more options on custom charts, here is a walkthrough on how you can complete this JSChart.
Step 1
Add the ChartJS CDN code to the header of your app.
<script src="https://cdnjs.cloudflare.com/ajax/libs/Chart.js/3.7.0/chart.min.js" integrity="sha512-TW5s0IT/IppJtu76UbysrBH9Hy/5X41OTAbQuffZFU6lQ1rdcLHzpU5BzVvr/YFykoiMYZVWlr/PX1mDcfM9Qg==" crossorigin="anonymous" referrerpolicy="no-referrer"></script>
Step 2
Add a Custom Component. Add the following settings in calculations in the Data Source of the component.

Step 3
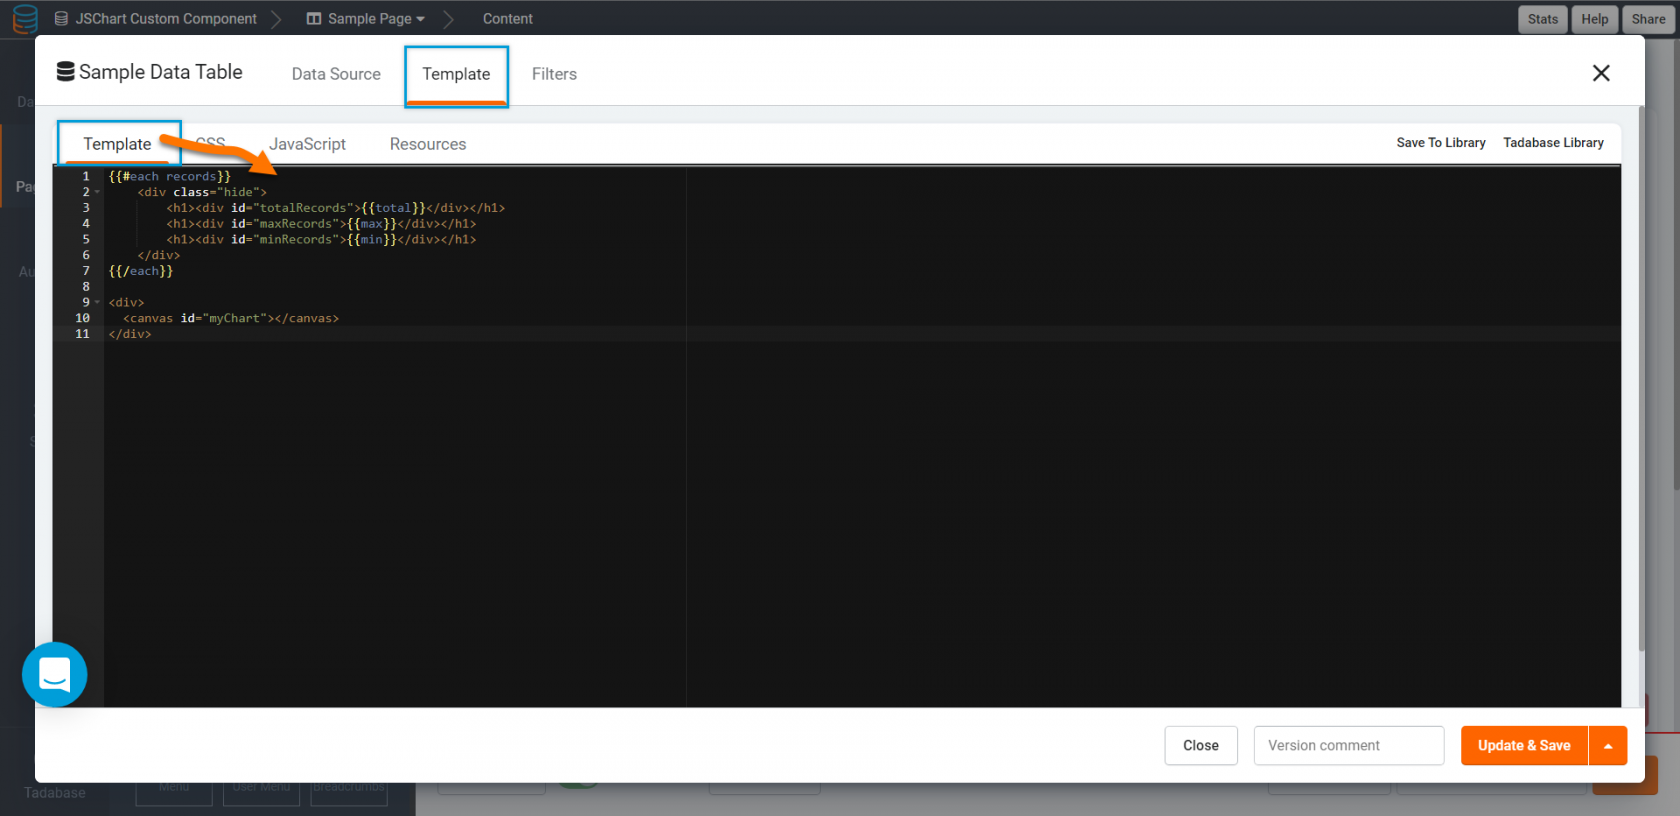
In your custom component template tab, add the following code.
{{#each records}}
    <div class="hide">
        <h1><div id="totalRecords">{{total}}</div></h1>
        <h1><div id="maxRecords">{{max}}</div></h1>
        <h1><div id="minRecords">{{min}}</div></h1>
    </div>
{{/each}}

<div>
  <canvas id="myChart"></canvas>
</div>
Step 4
Add the following code to the JavaScript tab within your custom component.
$(document).ready(function() {
    var total = $("#totalRecords").html();
    var max = $("#maxRecords").html();
    var min = $("#minRecords").html();

    new Chart(document.getElementById("myChart"), {
        type: 'bar',
        data: {
            labels: ["Total", "Max", "Min"],
            datasets: [{
                label: "Totals",
                backgroundColor: ["#3e95cd", "#8e5ea2", "#3cba9f"],
                data: [total, max, min]
            }]
        }
    });

});
We'd love to hear your feedback.