Google Charts Integration
Please note that this is now available as a plugin for easier installation. While you can use this document as a reference, the recommended method to add this functionality is through the plugin installation wizard. Learn more about plugins here.
This snippet will show you how to integrate Google Charts into Tadabase apps.
Example:
Data Table
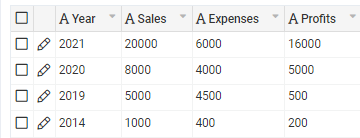
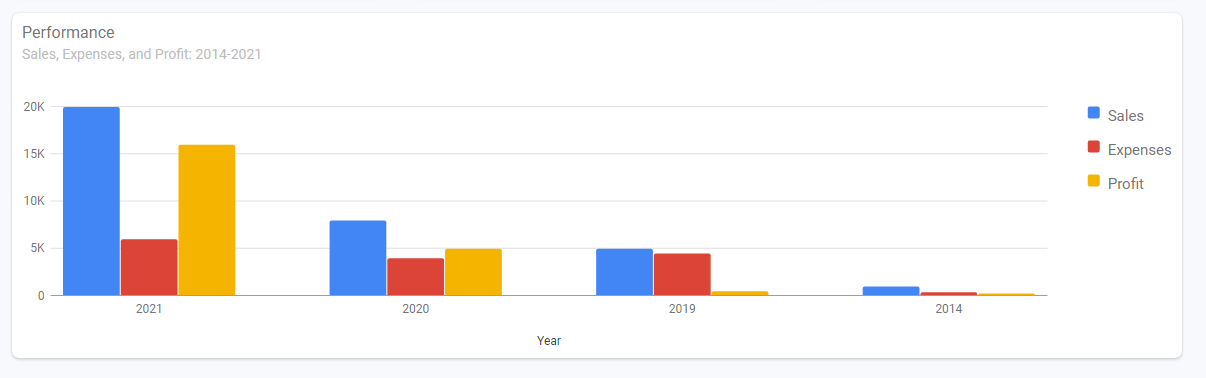
Chart result
Step 1
Under settings > custom footer add below script tag
<script src=“https://www.gstatic.com/charts/loader.js 3”>
Step 2
Add datatable to page, add fields which you will be using for charts. Add CSS class to your table “snip-table-hide” to hide your table from UI.
Step 3
In CSS tab hide the table using css
.snip-table-hide {
display: none;
}
.snippet-chart{
width: 100%;
max-width: 100%;
max-height: 345px;
display: block;
box-sizing: border-box;
height: 345px;
padding: 10px;
box-shadow: 0 0px 2px 0 rgb(0 0 0 / 16%), 0 2px 3px 0 rgb(0 0 0 / 12%) !important;
background: #fff;
border-radius: 7px;
}
Step 4
Create a HTML component where you want to add charts. click on “<>” in custom editor and add below
<div id=“columnchart_material” class=“snippet-chart”>
Step 5
Add below JS code (change component and field accordingly)
Example from: “https://developers.google.com/chart/interactive/docs/gallery/columnchart#creating-material-column-charts 6”
   (function() {

      let dataArr = []; // your data for chart

       TB.render('component_20', function(data) {
           dataArr = [];
           dataArr.push(['Year', 'Sales', 'Expenses', 'Profit']);
           // loop though the data.
           data.records.forEach(item => {
               dataArr.push([item.field_164, parseInt(item.field_165), parseInt(item.field_166), parseInt(item.field_167)]);
           });

           google.charts.load('current', { 'packages': ['bar'] });
           google.charts.setOnLoadCallback(drawChart);
       });

       function drawChart() {
           let data = google.visualization.arrayToDataTable(dataArr);

           let options = {
               chart: {
                   title: 'Performance',
                   subtitle: 'Sales, Expenses, and Profit: 2014-2021',
               },
               is3D: true
           };

           let chart = new google.charts.Bar(document.getElementById('columnchart_material'));
           chart.draw(data, google.charts.Bar.convertOptions(options));
       }

    })()
Original Community Post:
https://community.tadabase.io/t/google-charts-integration/1501
We'd love to hear your feedback.